You're two weeks from your website kickoff call. The budget's approved, your team is assembled, and momentum is building. But 34% of website projects globally experience scope creep, and only 55% complete on time. The difference? Companies that answer critical planning questions before design begins complete projects 40% faster and see conversion rates 2-3x higher post-launch.
Before you approve that first wireframe or finalize your sitemap, these questions determine whether your website becomes a lead-generating system or an expensive digital brochure.
Strategic foundation
Website goals aren't aspirations, they're measurable objectives that connect every design decision to business outcomes.
When a cloud services provider sets a goal to generate qualified demo requests, that objective shapes landing page architecture, form placement, content hierarchy, and conversion tracking.
Without this clarity, you're designing by aesthetic preference rather than strategic intent.
How do your website goals connect to business priorities?
Start by identifying your top three business objectives. Expanding enterprise accounts? Accelerating product trials? Reducing support volume?
Each business priority translates directly into a website goal with specific success metrics.
If accelerating sales cycles is your enterprise priority, your website goal might be implementing marketing automation for lead nurturing. This becomes the foundation for every technical decision that follows. Your CMS selection, integration requirements, and content architecture all flow from this alignment.

What KPIs will measure success?
Generic traffic goals don't drive accountability. Establish baseline metrics first, document current traffic, conversion rates, and engagement benchmarks. Then set SMART targets that create direct lines of sight between website performance and business outcomes.
Map primary KPIs to your core objectives. If lead generation is your focus, demo submissions become your primary metric, with secondary indicators like form completion rates and page engagement depth. Conp Google Analytics 4 or your enterprise platform to track these specific conversion paths before launch, not after.
Companies tracking 3-5 focused KPIs see 23% better project outcomes than those monitoring 10+ vanity metrics. The discipline isn't in measuring everything, it's in measuring what matters.
Audience intelligence
Defining your target audience means creating buyer personas that capture needs, pain points, and decision-making processes with enough specificity to guide architecture decisions. A persona representing a VP of IT evaluating security features requires different navigation patterns, content depth, and proof points than a persona representing a marketing director seeking ease of implementation.
What buyer personas shape your design priorities?
Build personas from market research and stakeholder interviews, not assumptions. Interview your sales team about common objections. Talk to customer success about implementation challenges. Survey recent customers about their evaluation criteria.
A technical decision-maker persona might require detailed API documentation prominently placed in site navigation. A business buyer persona needs ROI calculators and case studies filtered by industry. These aren't nice-to-have features, they're fundamental architecture requirements that flow from understanding who makes purchase decisions and what information they need at each stage.
How does user journey mapping reduce friction?
Map every step from initial discovery through purchase or support interaction. Where do visitors first encounter your brand? What content do they consume during evaluation? Where do they drop off in the conversion process?
This mapping reveals conversion path optimization opportunities and identifies friction points that increase bounce rates. When you visualize the journey from awareness (blog post) to consideration (product pages) to decision (demo request), you can structure content hierarchy and calls-to-action that align with natural buyer progression rather than internal org charts.
What research validates our assumptions?
Combine quantitative data, website analytics, keyword analysis, competitor benchmarking, with qualitative insights from sales teams and customer interviews. Analytics show you what visitors do. Interviews reveal why they do it.
One enterprise software company discovered through customer interviews that their primary persona never reached product pages because they couldn't find the integration information they needed upfront. Analytics showed high bounce rates. Interviews revealed the cause. This combination drove a navigation redesign that increased product page traffic by 47%.
Budget and resource planning
Accurate cost estimation prevents mid-project funding gaps that compromise scope or quality. Your budget should reflect project complexity, required integrations, custom functionality needs, and ongoing maintenance, not industry averages divorced from your specific requirements.

What does a realistic budget include?
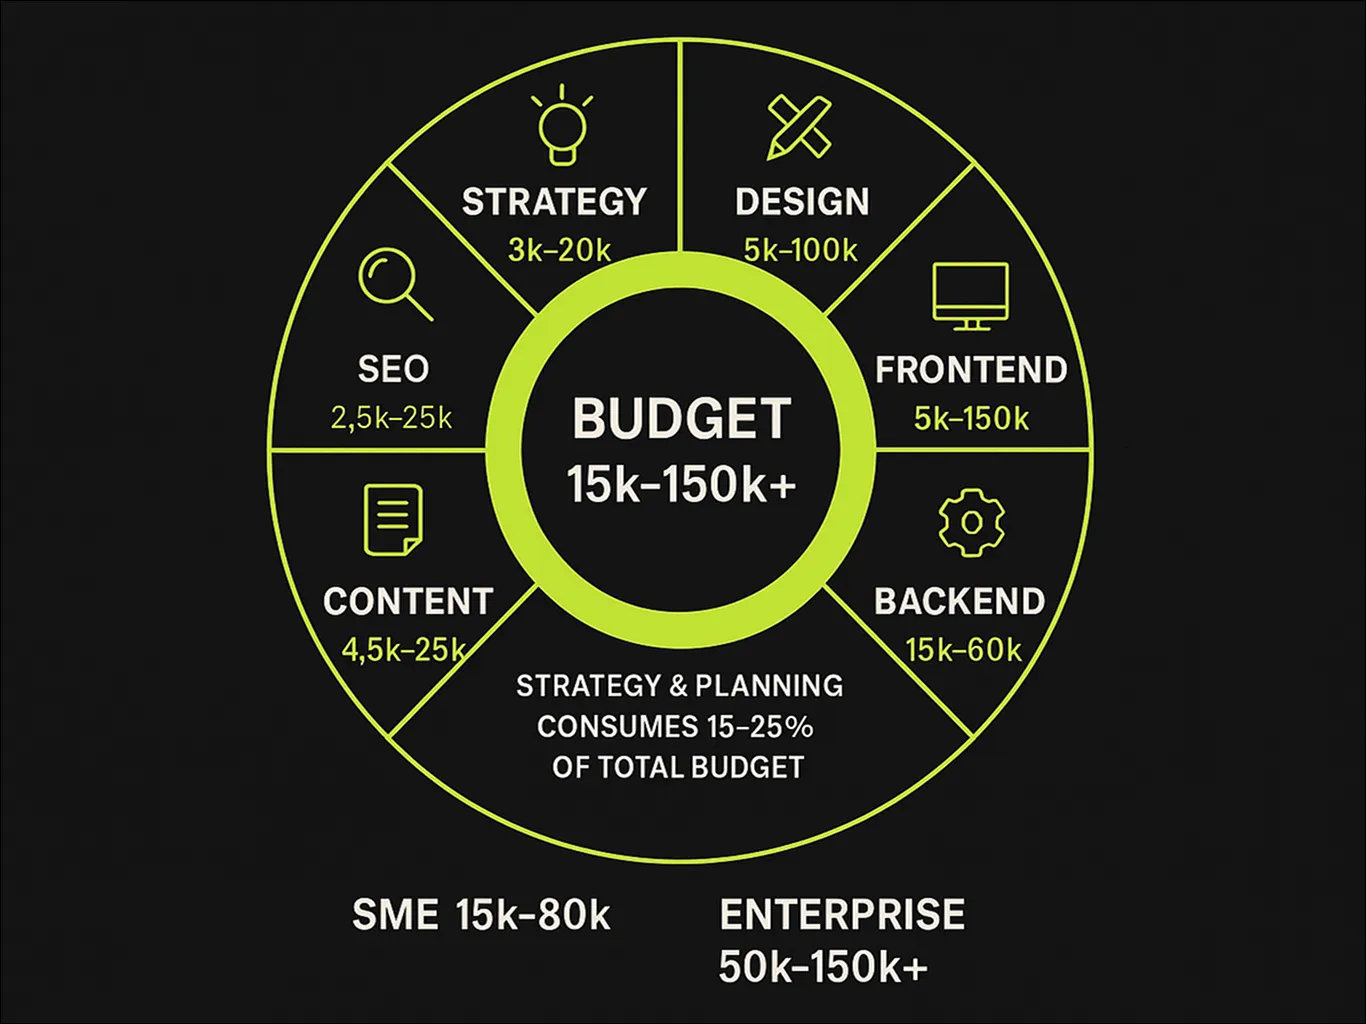
Budget allocation typically breaks down across six core components for B2B tech websites.
Industry data shows typical B2B website projects range from $15,000–$80,000 for SME implementations and $50,000–$150,000+ for enterprise platforms. Strategy and planning should consume 15-25% of the total budget. Underfunding this phase is the primary cause of the 34% of projects experiencing scope creep.
How do you account for hidden costs?
Set aside 10-15% contingency for unforeseen requirements. Audit existing assets before project kickoff, identify outdated plugins, legacy code dependencies, and compliance requirements that might surface mid-project.
Pre-define change request protocols with hourly rates agreed upfront. When stakeholders request additions after scope approval, having this framework prevents budget surprises and timeline extensions.
What ROI should you expect?
Calculate ROI by comparing additional revenue generated against total project investment. With average B2B cost per lead at $200, a site converting at 10% versus industry average 2-5% creates significant value quickly.
Consider a B2B website generating 1,000 monthly visitors. At 2% conversion, you capture 20 leads monthly ($4,000 value). At 10% conversion from strategic planning and optimization, you capture 100 leads monthly ($20,000 value). The additional 80 leads represent $16,000 in monthly acquisition value, $192,000 annually. A $50,000 investment pays back in under four months.
SEO content marketing delivers 748% average ROI with 9-month breakeven. Email marketing integrated with website forms achieves 3,600-4,000% ROI. These aren't theoretical returns, they're documented benchmarks from companies that planned strategically rather than designed aesthetically.
Timeline and project phases
Structured timelines break projects into distinct phases, discovery, design, development, testing, launch, ensuring each stage receives adequate focus. Sequencing tasks properly and setting clear milestones creates accountability and prevents the bottlenecks that plague 45% of late-finishing projects.
What timeline should you expect?
Comprehensive B2B website redesigns average 4-6 months from kickoff to launch. Basic sites require 2-3 months. Complex enterprise platforms extend 6-12 months. Content creation, the most underestimated phase, causes more delays than technical development.
Phase-by-Phase Breakdown:
- Discovery & Strategy: 4-6 weeks for stakeholder workshops, competitive analysis, technical requirements
- Design & Prototyping: 4-6 weeks for wireframes, visual design, user testing
- Development: 3+ months for CMS implementation, integrations, custom functionality
- Content Creation: Parallel to design/development, with 2-3 weeks for each major page
- Testing & QA: 2-3 weeks for functional testing, browser compatibility, user acceptance
- Launch & Monitoring: 1-2 weeks for deployment, DNS configuration, performance optimization

What causes timeline delays?
Late stakeholder involvement creates a major impact when new decision-makers join mid-process without context. Scope changes during development add significant time, just three additional pages can add 50+ hours when including design, development, content, and testing across the full implementation.
Content delays remain the most common bottleneck. In-house teams juggling regular responsibilities rarely have dedicated bandwidth for the quality content creation websites require. Plan for professional content support or allocate internal resources exclusively to this work.
How do you manage deadlines effectively?
Use project management tools to assign tasks, track progress, and automate reminders. Define sprint lengths or milestone dates, then conduct weekly check-ins reviewing completed work, upcoming deliverables, and emerging risks.
Celebrate achievements at each milestone. Teams that recognize phase completions maintain momentum better than those focused solely on final launch. This isn't soft management, it's risk mitigation against the burnout that degrades quality in month four of six-month projects.
SEO and content strategy
Integrating SEO and content strategy from project inception ensures site architecture, page templates, and editorial calendars optimize for organic visibility. Early collaboration between strategists, designers, and developers prevents the costly rework that happens when SEO becomes an afterthought.
What keyword research shapes content planning?
Identify high-value keywords related to product offerings, industry challenges, and solution benefits. Ninety percent of B2B buyers start their journey with online search, conducting an average of 12 searches before interacting with your website. Your content must align with this research behavior.
Group keywords into content pillars, thematic clusters like "API Integration Best Practices" or "Cybersecurity for SaaS," then develop content roadmaps aligned with buyer personas and user journeys. This pillar-cluster model helps search engines understand topical authority while providing buyers comprehensive information organized logically.
How does technical SEO impact performance?
Technical SEO ensures search engines efficiently crawl, index, and understand your pages. Implement structured data using Schema.org markup for organization details, breadcrumbs, and page types. This semantic markup enables rich results and reinforces entity relationships that search engines use for ranking.
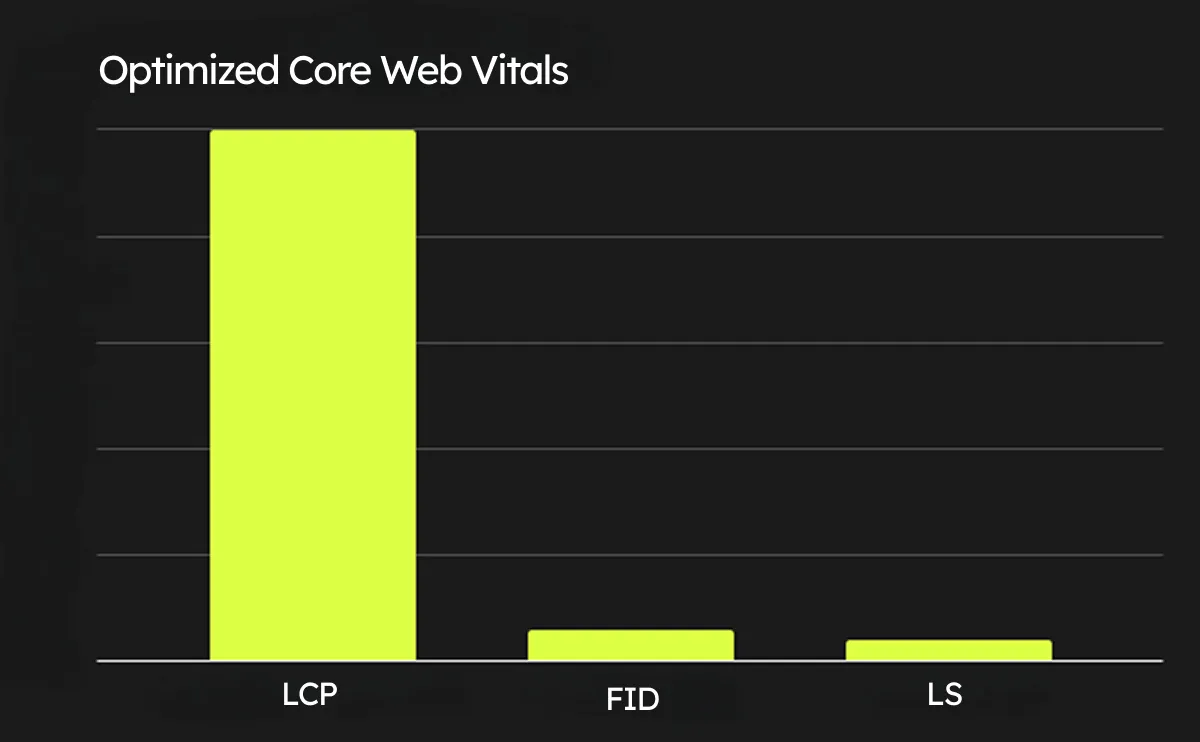
Optimize Core Web Vitals: Largest Contentful Paint under 2.5 seconds, First Input Delay under 100 milliseconds, Cumulative Layout Shift under 0.1. These performance metrics directly impact both search rankings and user experience. Mobile-friendliness is non-negotiable. 48% of B2B ad spend now flows to mobile, projected above 50% by end of 2025.
Secure protocols (HTTPS), XML sitemaps, and clean URL structures form the foundation. SEO traffic drives 1,000% more traffic than organic social media and converts at 14.6% compared to 1.7% for outbound methods.
What analytic configuration do you need?
Set up Google Analytics 4 for visitor behavior tracking, a tag management system for event tracking, and integrations with CRM and marketing automation platforms before launch. Comp goal funnels for demo requests, content downloads, and form submissions to monitor conversion paths from day one.
Track organic traffic growth, keyword rankings, conversion rates by source, and user engagement metrics. Companies that establish measurement frameworks pre-launch iterate faster and optimize more effectively than those adding analytics retroactively.
Agency selection
Selecting a web design and development partner requires assessing technical proficiency, communication protocols, and cultural fit, not just reviewing portfolios. The right agency demonstrates proven B2B tech experience, transparent project management, and commitment to long-term partnership beyond initial launch.
What experience should you verify?
Request case studies showcasing complex integrations, scalable architectures, and enterprise security implementations. Ask about specific results, lead volume increases, conversion rate improvements, efficiency gains, and request references from comparable technology companies.
Agencies experienced in B2B tech understand longer sales cycles, multiple decision-makers, and the technical depth buyers expect. This isn't aesthetic work, it's systems engineering that happens to have a visual interface. Verify they grasp this distinction.
How do agencies and freelancers compare?
Established agencies offer integrated teams including strategists, designers, developers, and SEO specialists, along with formal processes for quality assurance and risk management. This structure provides redundancy, if one team member becomes unavailable, the project continues.
Freelancers often offer lower costs and faster pivots but typically lack the capacity, proprietary tools, and guarantee structures enterprise projects require. For a $15,000 branding refresh, a talented freelancer may excel. For a $75,000 platform with CRM integration and marketing automation, agency infrastructure mitigates risk.
What makes a strong partnership?
Clarify reporting frequencies, escalation procedures, and support service level agreements upfront. How does the agency integrate with your internal teams? How do they share documentation? What does post-launch support include?
Agencies that invest in relationship building and continuous improvement deliver value beyond initial launch. Your website isn't a one-time deliverable, its infrastructure requiring ongoing optimization, content updates, and technical maintenance. Partners who understand this provide strategic counsel, not just tactical execution.
Strategic planning drives measurable results
The questions above aren't administrative checklists, they're diagnostic frameworks that separate websites generating qualified leads from expensive digital brochures gathering dust. Companies that answer these questions before design begins complete projects faster, stay within budget, and achieve conversion rates 2-3x higher than industry averages.
Prompt Digital brings decades of experience guiding B2B technology companies through strategic planning that aligns website objectives with enterprise goals. Our approach combines audience intelligence, measurable KPIs, technical SEO frameworks, and transparent project governance to deliver digital solutions that drive growth.
Ready to build a website that performs? Start with strategic planning that sets the foundation for success. Contact us to explore how Prompt can bring your vision to life.

The Prompt Team
The Prompt Team is our collective of designers, developers, and strategists translating real project experience into clear, useful insights. Each article reflects our team’s combined expertise, a practical approach to helping brands navigate digital design, strategy, and growth with confidence, clarity, and purpose, built on years of collaboration, curiosity, and hands-on results.

Daniela Aranaga
Daniela keeps Prompt running with clarity and momentum, managing internal operations, optimizing workflows in ClickUp, and leading the team’s social media presence. A SearchAtlas expert fluent in SEO and AEO best practices, she connects process and performance to keep every system, and story, aligned.